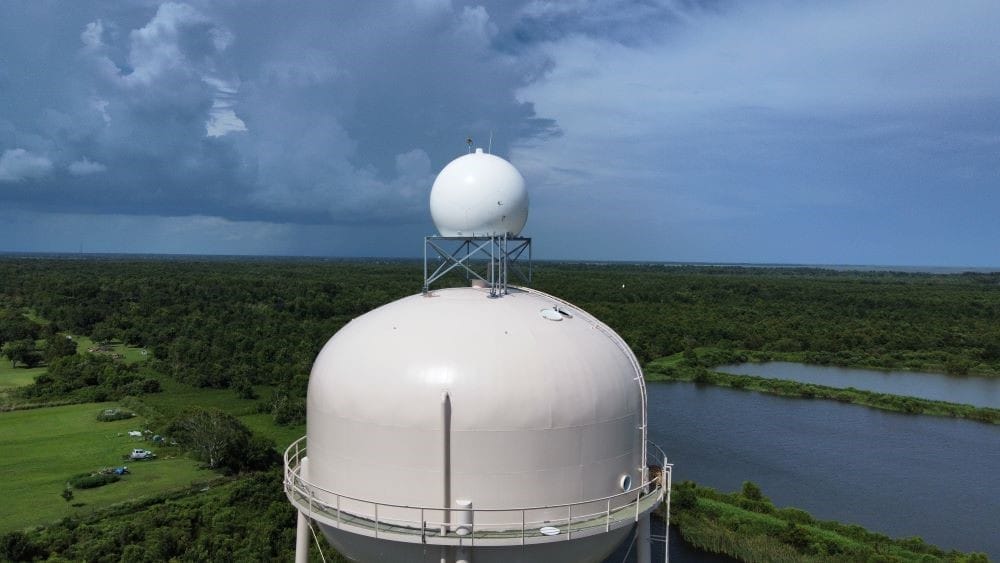
X-band Radar and Superior Winter Weather Detection
Weather radar is one of the most successful observing systems for scanning the skies and monitoring for rain, snow, hail, damaging winds, and tornadoes.
In the United States, government agencies, businesses, and citizens are lucky to have one of the best radar networks in the world. NEXRAD (Next Generation Weather Radar) is an extensive network of radar sites around the country that help meteorologists determine weather information including, but not limited to, wind direction and speed, and precipitation type and intensity. Federal agencies, such as the National Weather Service and the Federal Aviation Administration, operate this network of long-range weather radars that guide the issuance of severe weather advisories, watches, and warnings.
What Are Low Level Radar Coverage Voids?
Unfortunately, NEXRAD doesn’t see everything. “The vast radar network across the United States is of the highest quality in the world, yet still has limitations,” (Forbes).
What causes these gaps in NEXRAD coverage? Large swaths of the lower atmosphere under 4,600 ft remain unobserved as the earth curves away from the lowest beam of the nearest government radar or due to mountains or other blockages.
The Problem with Low Level Radar Data Voids
With the increased frequency and severity of weather events over the past 50 years, (public.wmo.int) voids in weather coverage can be severe. Filling in these spots is critical for flash flood warnings, low-level mesocyclone observations, and improved forecast modeling which depend on measurements near the surface. Diminished radar coverage leaves surrounding residential and commercial areas vulnerable to sudden weather events and results in less accurate forecasts.
“I’m intrigued and concerned (about the radar gap in the Lehigh Valley) given the rise of inclement weather,” said State Rep. Mike Schlossberg, whose district covers Allentown and parts of South Whitehall Township. “It strikes me this is going to become an issue of timeliness. Like it or not, we know that climate change is on the rise. We know we’re going to have more severe weather. It’s incumbent upon us as a community to have the most advanced technology available to take protective actions and prevent loss of life,” (The Morning Call).
While forecasters may have the ability to look at other data available to them to make conclusions to fill in holes in the picture, that isn’t enough when severe weather events threaten communities and businesses.
A meteorologist, Ed Vallee of Empire Weather, in the Morning Call article stated: “At the end of the day if we have the ability to get better data at the lower levels, it would be a much more confidently conveyed situation,” (The Morning Call).
The problem is clear: “Radar gaps are clearly a critical issue,” (American Meteorological Society Journal).
Winter Precipitation
To understand the importance of low level radar observations, it is important first to understand the types of winter weather that occur at lower levels of the atmosphere. Winter precipitation refers to any form of water that falls from the sky and reaches the ground in a solid, frozen state during the winter season. This includes a variety of frozen particles, such as snow, sleet, and freezing rain, each with distinct characteristics and formation processes.
Snow
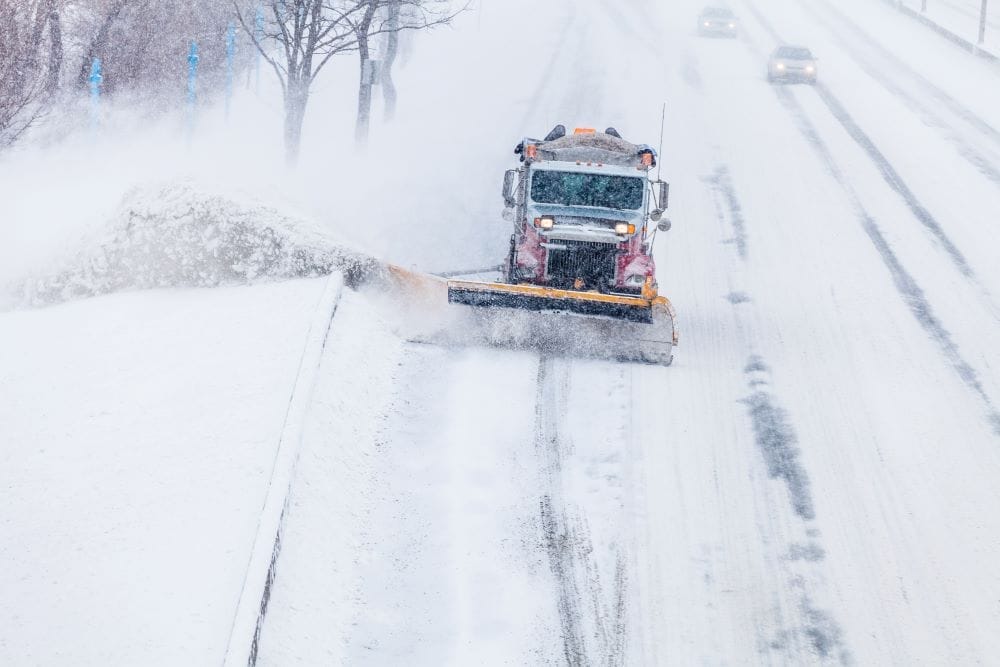
Snow consists of ice crystals that form in the clouds and fall to the ground as flakes. Snow forms when the temperature in the clouds and near the ground is below freezing (32°F or 0°C). The shape and size of snowflakes depend on factors such as temperature, humidity, and atmospheric pressure. It typically occurs in cold climates and regions with low temperatures. Snowflakes come in a variety of intricate shapes, influenced by temperature and humidity conditions.
Sleet
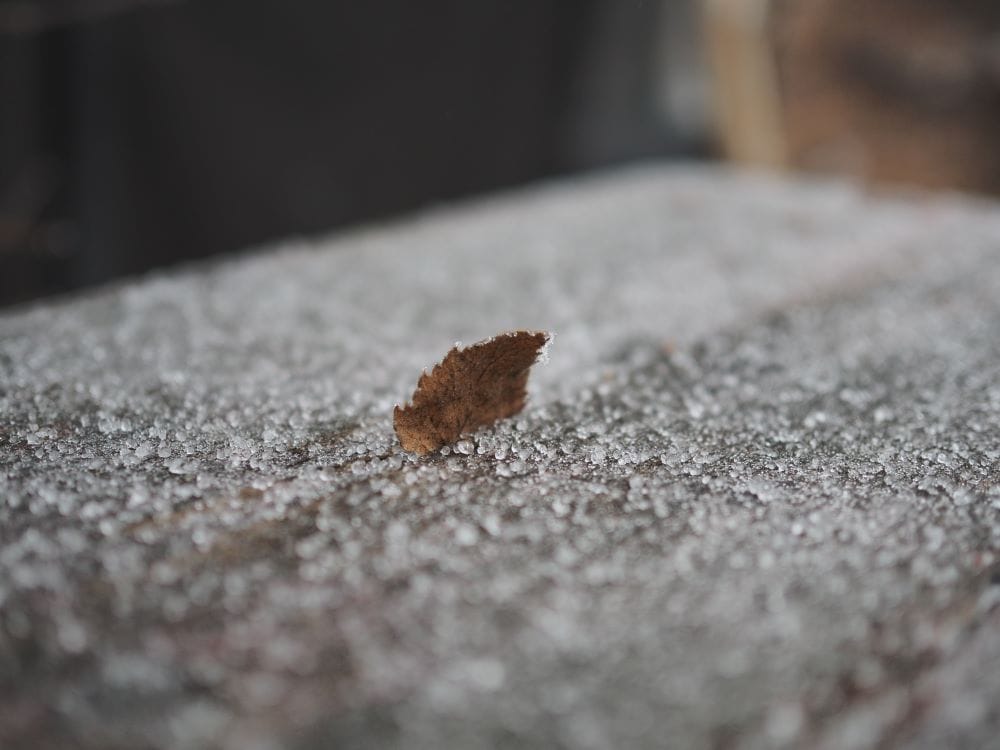
Sleet forms when there is a warm layer aloft, melting snowflakes into raindrops, followed by a deep layer of freezing air near the ground. Raindrops freeze into ice pellets before reaching the surface. It often happens in areas where the temperature is near freezing, causing rain to turn to ice upon contact with cold surfaces. Sleet can create hazardous driving conditions and icy surfaces.
Freezing Rain
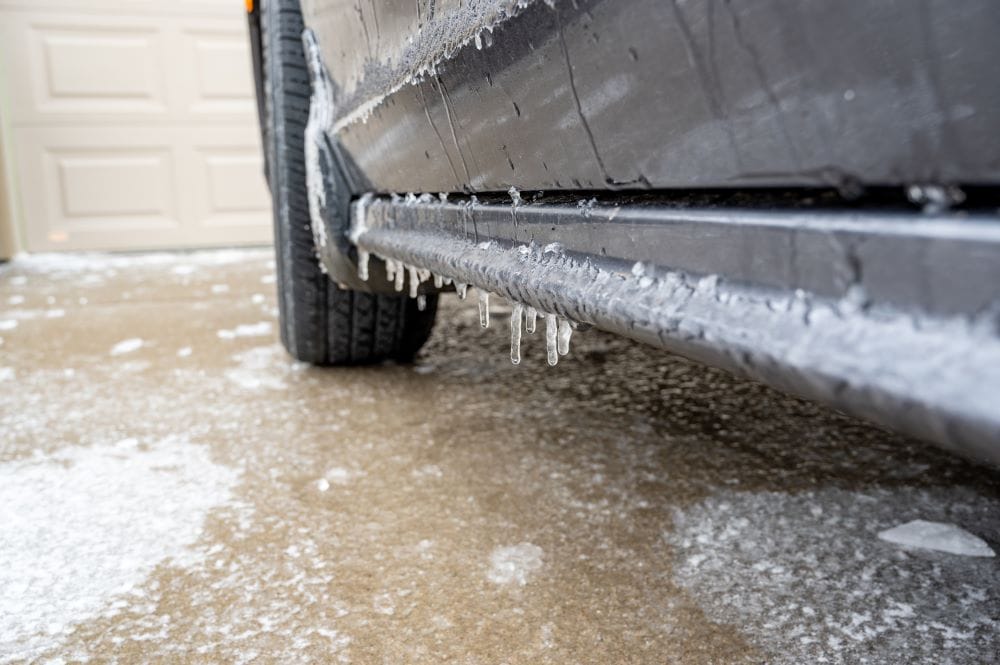
Freezing rain occurs when a shallow layer of cold air near the surface is beneath a layer of warmer air aloft. Raindrops fall through the warm layer, turn into supercooled liquid, and freeze upon contact with surfaces at or below freezing. The raindrops contact with the freezing surface creates a glaze of ice, known as “ice storms.” Freezing rain can lead to power outages, damage to trees, and treacherous travel conditions.
Winter Precipitation Risk
Winter precipitation can have a profound impact on communities and various business sectors, causing disruptions that range from logistical challenges to financial losses.
Community leaders and emergency managers need to have reliable insight into the formation and location of certain types of winter precipitation. The wrong weather insights can lead to the wrong equipment being set up or the equipment not being prepared in time. For example, community decision makers may set up snowplows to address snow when really road salt needs to be laid to combat icing. Or if the location and timing of frozen precipitation is incorrect due to lack of radar observations, decision makers may send resources to the wrong location at the wrong time wasting, time and money and potentially leaving people stranded or emergency vehicles from reaching people in need.
A variety of industries also can be negatively impacted by winter precipitation, especially when they have incorrect weather insights.
Energy
Winter weather can lead to power outages as ice accumulates on power lines and utility equipment. Just a half an inch of ice can cause severe damage to trees and power lines, often resulting in numerous downed trees and widespread power outages that might last for days. The most destructive ice storms produce ice amounts of an inch or greater. (Fox Weather) Utilities often need to allocate additional resources to repair and maintain infrastructure during these winter storms.
Transportation
Airlines face flight delays and cancellations due to icy runways and snow accumulation. Additionally increased costs can occur such as de-icing larger aircraft which can cost over $13,000. Road transportation experiences challenges, with hazardous driving conditions leading to accidents, road closures, and supply chain disruptions. Rail and public transportation can be affected, leading to delays in passenger and cargo services.
Agriculture
Farmers must protect crops and livestock from freezing temperatures, which can damage or destroy crops and lead to increased heating costs for animal shelters. Winter weather can also disrupt the transportation of agricultural products, affecting distribution and supply chain logistics.
Radar Observations are Key
Meteorologically speaking, it can be difficult to forecast freezing rain events. This is because freezing rain is characterized similarly to that of sleet such that temperatures in the lower levels of the atmosphere warm enough such that snow melts, although not completely. However, for freezing rain, there is a shallow warm layer near the surface (i.e., a temperature inversion) that causes the precipitation to ‘re-freeze’ which causes freezing rain to occur. Therefore, more accurate estimates of the lower-level thermodynamic information and/or radar data would be critical in correctly assessing the transition zone between rain, snow, sleet, and freezing rain.
In terms of weather radar information, variables such as differential reflectivity (ZDR) and/or Correlation Coefficient (CC) produce signals that are easily identifiable as a change of hydrometeor type. For example, melting precipitation is identified by a lowering of CC, which is a well-known phenomenon referred to as the ‘bright band’. Leveraging thermodynamic information in conjunction with high resolution radar data allows for better hydrometeor classification, especially near the surface when close to the weather radar.
Another useful radar parameter is the specific differential phase (KDP). Because KDP is inversely proportional to the wavelength of a weather radar, this leads to the fractional error in KDP estimates at X-band being 5-6 times smaller than at S-band (Ryzhkov and Zrnic, 2019). This is a reflection of a general fact that the polarimetric data at X-band usually looks cleaner and less noisy than at S-band. Studies have also shown that X-band polarimetric data offers improved information about the location of hydrometeor transition zones due to enhanced KDP signatures (Thompson et al., 2014).
Climavision’s Wendell, Minnesota radar provided a great example of improved precipitation detection on October 31st, one inch of snow fell in Grant County, per local weather station reports. As seen in the following radar loop images, Climavision’s radar detected snow for several hours, while the closest NEXRAD locations missed the majority of the snowfall event. It is important to note that radar coverage in Minnesota is sporadic, making Climavision radar installations even more important.
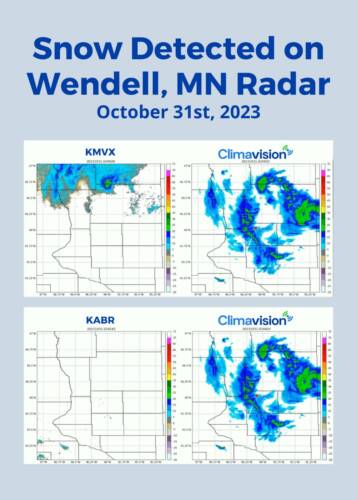
If you’d like to read more about this event and additional events showcasing Climavision’s radar network performance in 2023, click to view our 2023 Radar as a Service Recap blog post.
Is Anyone Solving the Winter Weather Coverage Issue?
At Climavision we’re deploying our own network of high-resolution radars to close significant weather observation data voids and drastically improve forecast speed and accuracy. Over the next 4 years, Climavision is rolling out over 200 radars across the continental United States. So far, we have several radars installed. One of the North Carolina Radars is in the Charlotte area – one of the most prominent gaps in the country. Over 41% of North Carolina’s population lived in a radar coverage void before we installed the Climavision radar for that area.
Our goal is to arm federal agencies, local Emergency Managers, and businesses with the high-resolution observations they need to properly keep communities, employees, and assets safe. Working with world-renowned experts and the University of Oklahoma, Climavision’s X-band radars were developed to utilize better algorithms and end-to-end dual-polarization measurements. This not only results in more accurate estimates of precipitation, but also provides better discrimination between different types of precipitation and non-meteorological signals such as birds, insects, dust storms, or even the debris field of an approaching tornado.
One major concern for those in need of a radar can be the cost. “The cost obviously goes into it,” said Randy Padfield, the director of the Pennsylvania Emergency Management Agency. “How does that get funded and where do you get the money? From our perspective, we don’t have funding that funds that,” (The Morning Call).
Padfield’s perspective is not a surprise. Most communities do not have the resources required to obtain a radar for themselves. The radars that comprise the NEXRAD network are very large, very expensive S-band radars. Not only do they require millions of dollars to initially install, but they also require a dedicated National Weather Service office and a substantial amount of funding per year to maintain.
Climavision radars simply supply weather data more efficiently. We offer access to this network as a simple subscription service called Radar as a Service, or RaaS. The major benefit of RaaS is that communities can have this crucial weather data through a low annual data services contract instead of burdening communities with the hassle of a multi-million-dollar radar acquisition.
Weather radars are one of the best tools for detecting and measuring critical weather phenomena. Climavision is filling the gaps by making these key tools available in every community. To learn more about Climavision’s RaaS solution, contact us.

