How to Read Radar Imagery
In atmospheric sciences, accurate data and weather insights are pivotal. Clear radar imagery serves as a critical data point in the weather toolbox of government emergency management (EM) agencies and business leaders alike. In this blog post we will discuss radar imagery by reviewing what radar stands for and how it works, how to accurately read and interpret the data that it provides, and how government entities and businesses can use it to save lives, assets, and respond more efficiently to inclement weather events.
Radar Basics
At its core, radar stands for RAdio Detection And Ranging. It is one of the most common pieces of equipment used in meteorology and understanding what is happening in the atmosphere at any given moment. Radar systems work by sending out radio waves. Those waves then bounce off different particles in the atmosphere and return to the radar site. By analyzing the signals returned, the system then is able to calculate the distance away from the radar site a particle is, as well as its size and uniformity. From there, someone analyzing the data can determine the difference between drizzle, a strong thunderstorm, a tornado, hail, smoke from a wildfire, and more.
Through quick scans of the atmosphere during a weather event, this tool provides a clear picture of the atmospheric dynamics at play. The key to making this data useful is the ability to understand and interpret what it means. Through different parameters, radar imagery offers invaluable insights into the behavior and development of weather systems.
Examining the Radar Image
There are two fundamental parameters in radar meteorology: reflectivity and velocity.
Reflectivity
The most basic product of radar analysis is reflectivity. As radio waves return to the radar site, the system deciphers the difference between lighter and heavier precipitation. The color scale of blue, green, yellow, and red helps us understand the storm intensity. Shades of red would indicate heavier rain within a convective system, compared to blue which indicates lighter precipitation like drizzle. Understanding the precipitation pattern of a system can enable emergency managers to prepare for road closures, respond to flooding, and more. For a variety of industries, this provides insight into the threat of outdoor events and a general understanding of where the strongest part of a threatening storm lies.
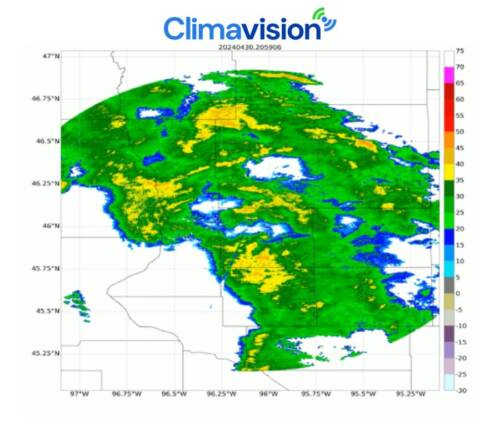 Reflectivity from our Grant County, Minnesota radar shows widespread precipitation with heavier pockets of rain.
Velocity
Velocity data is not possible without reflectivity, as a radar beam needs to bounce off particles in the atmosphere to better understand a storm’s movement. This fundamental variable gives a clear picture of both storm speed and dynamics, providing insight into possible rotation, damaging winds, and more. Velocity color tables are made up of two primary colors: red and green. A couple simple phrases can help those interpreting the data remember what the contrasting colors mean. Think “Green tomato toward” to remember cool shaded velocities indicate storm movement towards the radar location. Think “Red apple away” to remember warm shaded velocities indicate storm movement away from the radar location.
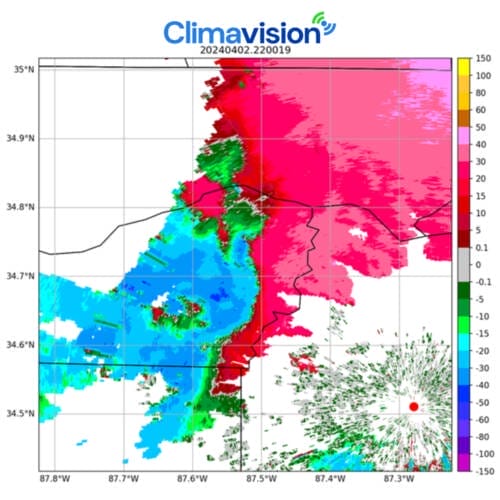
The velocity data above serves as an example of velocities moving towards and away from our Climavision radar site in Moulton, AL during a strong storm that produced a tornado.
As velocity provides clear insight into wind strength and storm motion, emergency managers and business response teams alike can utilize this data to keep civilians and personnel out of harm’s way by enacting emergency safety plans – especially if a tornado or damaging winds become a threat.
Basic Radar Signatures
As reflectivity and velocity are analyzed, it is important to look for these key radar features that could indicate impending danger.
Hook Echo
One of the most critical signatures to look for within a thunderstorm is a hook echo. This signal denotes rotation forming or happening within a supercell. Through analysis of reflectivity and velocity, we can determine if this rotation pattern is present, signaling the potential for the presence of a tornado. Within the reflectivity data, this can appear as a crochet-hook or fish tail. It is important to use velocity data in conjunction with reflectivity to further understand the situation. If the red and green are tightly wound together in the same location, rotation is present, and a tornado is either forming or on the ground. We call this a Velocity Couplet.

On March 14th, powerful storms hit the Midwest, including a tornado that crossed from Indiana to Kentucky, near our Dry Ridge, Kentucky radar. The images above are prime examples of a Hook Echo and Velocity Couplet.
For EM agencies and business leaders, timely identification of a hook echo is essential to enact proactive measures to mitigate the impacts of tornadoes on public safety and protection for personnel.
Squall Line
A squall line is visually very similar to how it sounds. Through powerful atmospheric dynamics, this phenomenon features a long band of organized thunderstorms in a linear format, often with powerful winds. Through radar imagery, EM agencies and business leaders can track the evolution of squall lines, understand their intensity, orientation, and speed. Armed with this intelligence, stakeholders can implement preemptive measures to safeguard critical infrastructure, optimize logistical operations, and ensure the continuity of business operations in the face of inclement weather.

Pictured above is an example of a squall lines captured by Climavision’s Dry Ridge, KY radar. You can see the line moves from west to east clearly in terms of reflectivity and velocity.
Radar Anomalies
Despite its efficacy, radars are susceptible to various anomalies and artifacts that necessitate discernment and contextualization:
Interference
From urban clutter to wind farm signatures, radar systems can be disrupted by non-meteorological phenomena that can compromise data integrity. Interference from these standing objects can be identified visually for their lack of movement, or abnormal movement, within the radar imagery. Through rigorous quality control measures and advanced signal processing techniques radar data providers like Climavision can mitigate the impact of interference, ensuring the fidelity and reliability of radar-derived intelligence for operational decision-making.
Smoke Plumes
In regions impacted by wildfires, plumes of smoke and ash can be detected by radar systems, particularly when low-level coverage is present. However, it is easy to differentiate between genuine precipitation returns and smoke that blows in uniform patterns with the wind, continually stemming from the same location. These can be identified through further radar analyses with the correlation coefficient to determine the non-meteorological particles in the atmosphere. Distinguishing the two is important for crisis response in fire-affected regions.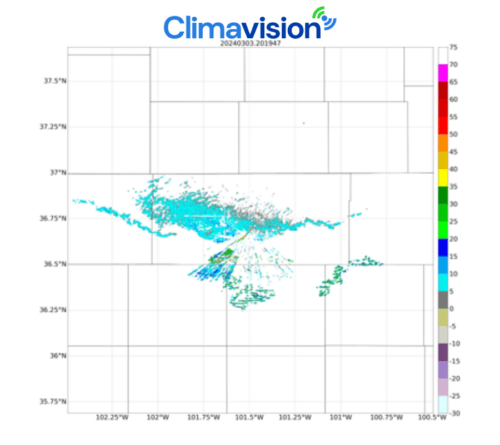
On March 3rd, our Guymon, OK radar picked up on smoke plumes from a nearby wildfire fueled by dry conditions and high winds. In instances like these, watching radar data in motion can be helpful in identifying non-meteorological phenomena that do not behave like a typical weather feature would.
Bird Roost Rings
Avian roosting behavior is another non-meteorological phenomenon that radars can detect. However, these rings can be easily attributed to birds by their ring-like returns. Distinguishing these rings from genuine weather phenomena is crucial for minimizing false alarms in radar-based decision support systems.
Why It Is Important to Understand Radar Imagery
Accurately interpreting radar imagery empowers decision-makers to make informed and proactive choices in response to impending weather threats. Whether it’s issuing timely evacuation orders, activating emergency response protocols, or preparing recovery measures, radar-derived data is crucial to the decision-making process for government agencies and businesses at the mercy of Mother Nature. By leveraging radar-based situational awareness, stakeholders mitigate the impacts of adverse weather events, safeguarding lives, property, and economic assets.
Precision Resource Allocation
For government EM agencies and weather-sensitive industries, resource allocation is critical. Radar data visualizations provide decision-makers with actionable intelligence regarding the location, timing, and severity of weather hazards, enabling them to deploy resources effectively and efficiently. From pre-positioning emergency personnel and equipment to prioritizing response efforts to the most impacted areas, radar-informed decision making optimizes resource utilization, enhances operational effectiveness, and fosters resilience in the face of adversity.
Risk Mitigation and Resilience Planning
In an era of extreme weather variability, risk mitigation and resilience planning are essential for government agencies and businesses alike. Radar imagery serves as a cornerstone in these endeavors, enabling stakeholders to identify, assess, and mitigate weather-related risks in real time with precision and foresight. By integrating radar-derived intelligence into risk assessment frameworks, decision-makers develop robust mitigation strategies and resilience plans that enhance community safety, protect critical infrastructure, and promote sustainable development.
High Resolution Radar Imagery With Climavision
Radar is an indispensable tool for understanding developing weather events and real time weather monitoring. No matter the severity of a weather event, accurate high resolution weather radar insights empower stakeholders to navigate a volatile atmosphere with confidence and clarity. It is imperative for decision-makers in government and business organizations not only to grasp the nuances of radar imagery and indicators for hazardous weather but also to ensure access to reliable radar coverage. Climavision is working to fill gaps in radar coverage with the largest proprietary radar network in the United States. We deliver the radar data as a simple subscription service called Radar as a Service (RaaS). Due to our innovative tech platform, users can view RaaS’s high resolution radar data via API or an interactive visual dashboard. If you would like to learn more about Climavision’s RaaS solution, contact us.


